Data Pipeline Builder
Leading the UX strategy for a foundational shift at Celonis — transitioning data engineers from a fragmented, modeling-first workflow to a declarative, asset-first visual experience that makes enterprise-scale pipelines legible at a glance.
The challenge
Bottleneck ontime to value
Before this project, the data integration process was fragmented and difficult to use. Users were locked into a rigid "modeling-first" workflow that required extensive manual configuration before they could begin any process analysis.
The legacy environment relied on imperative data jobs, which obscured visibility — making it hard for data engineers to track dependencies or understand how a single change might break downstream processes.
Prototyping the canvas at enterprise scale in Figma Make before any production UI work
Process
Kicking off with vibe coding and research
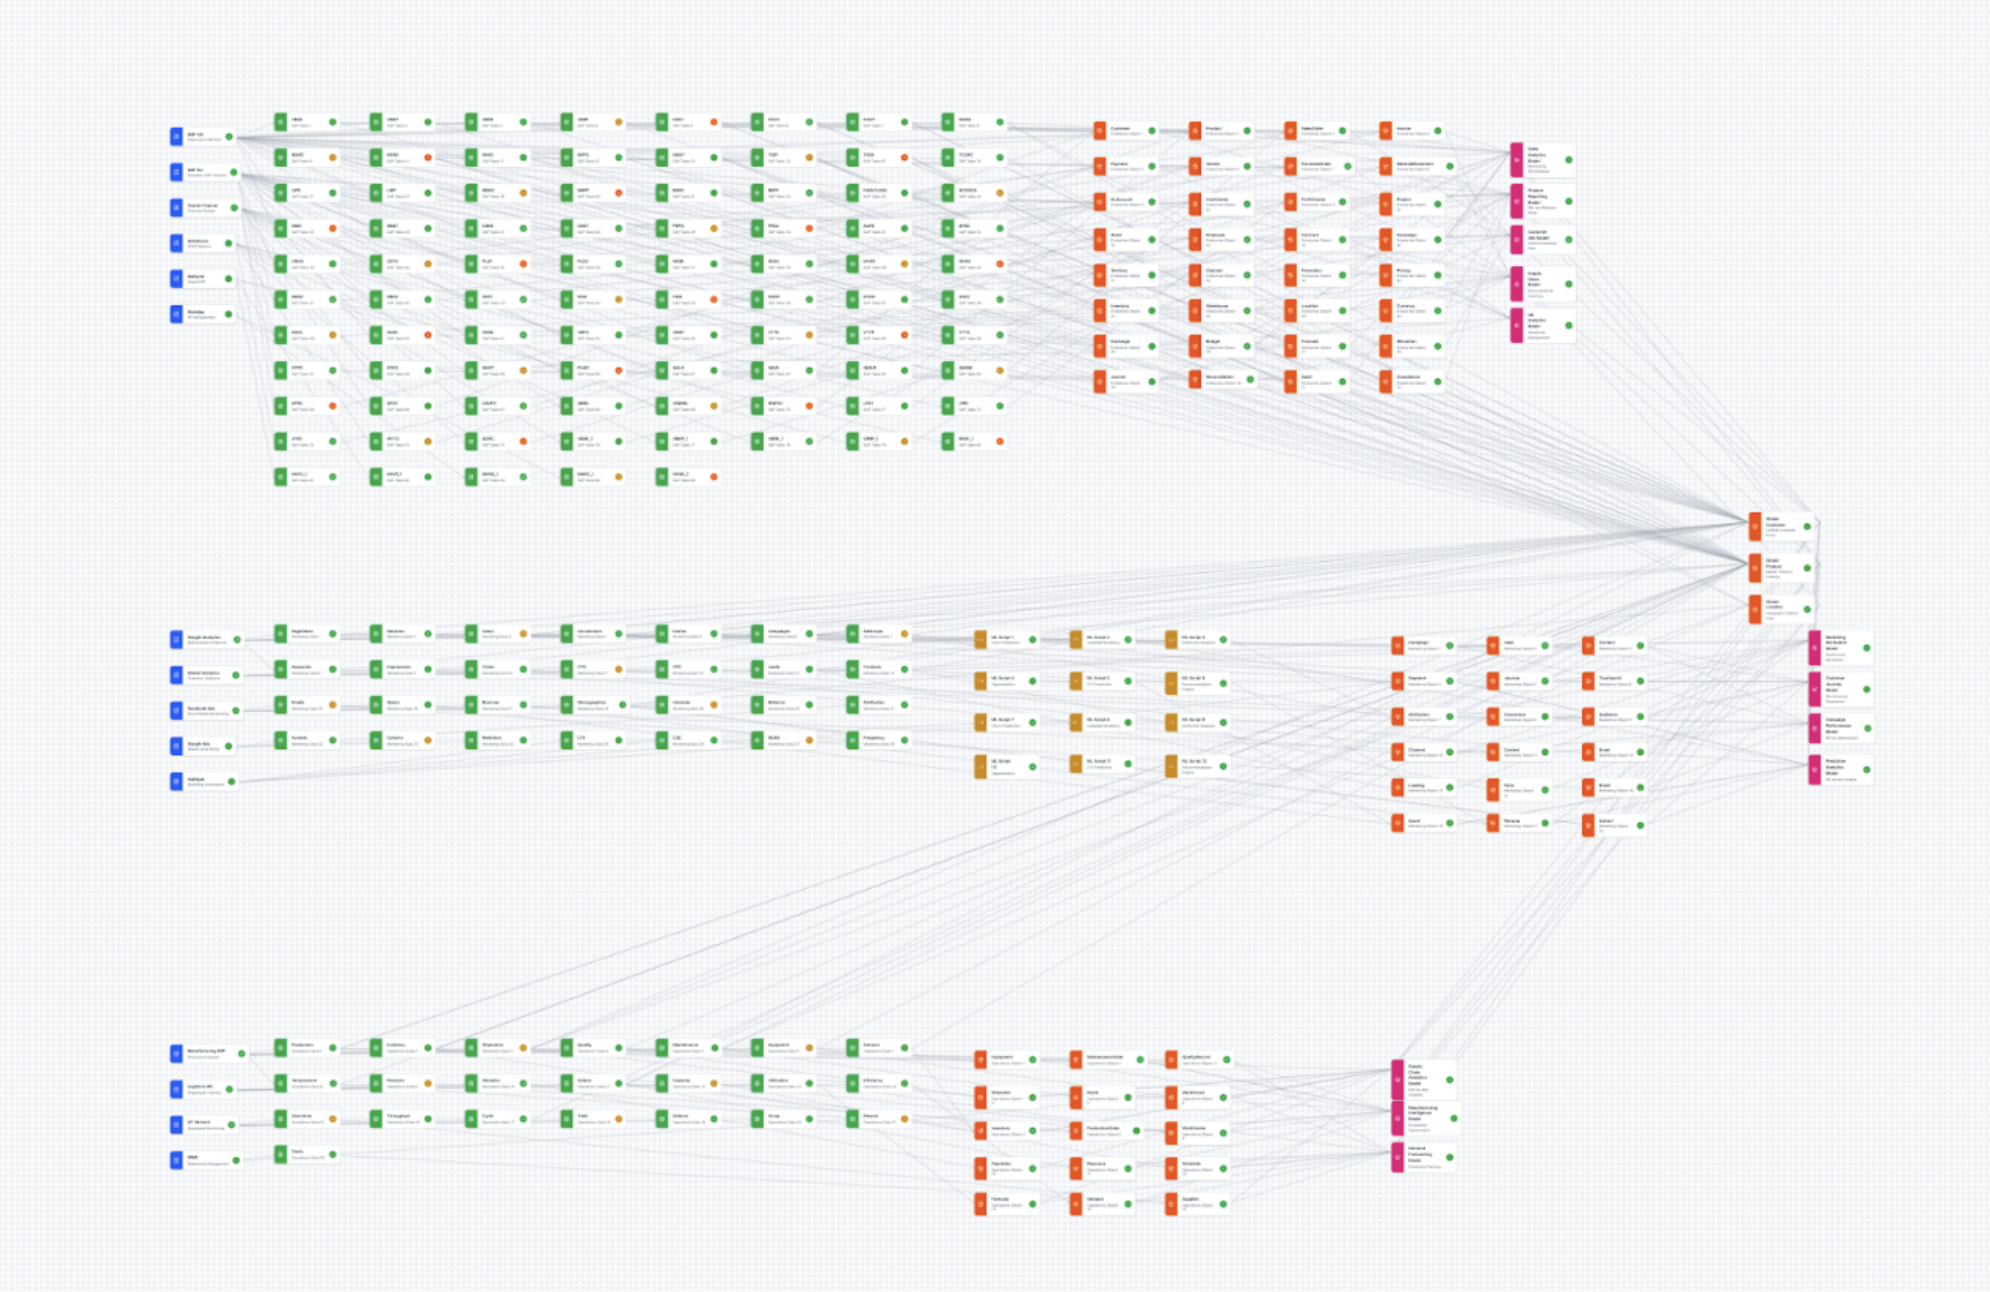
In the enterprise space, graph-based interfaces that look polished in Figma with 10+ nodes almost always lose utility when facing enterprise-scale data — hundreds to thousands of nodes. To avoid a costly engineering pivot mid-build and de-risk the UX, I initiated the project by vibe coding in Figma Make before any production UI work.
I researched industry examples and wrote scaling best practices with AI deep research tools, surveying libraries like React Flow, yFiles, and Teleport's Graph Explorer. The prototyping-first approach effectively spearheaded canvas interaction and lineage interaction design before a single engineer wrote production code.
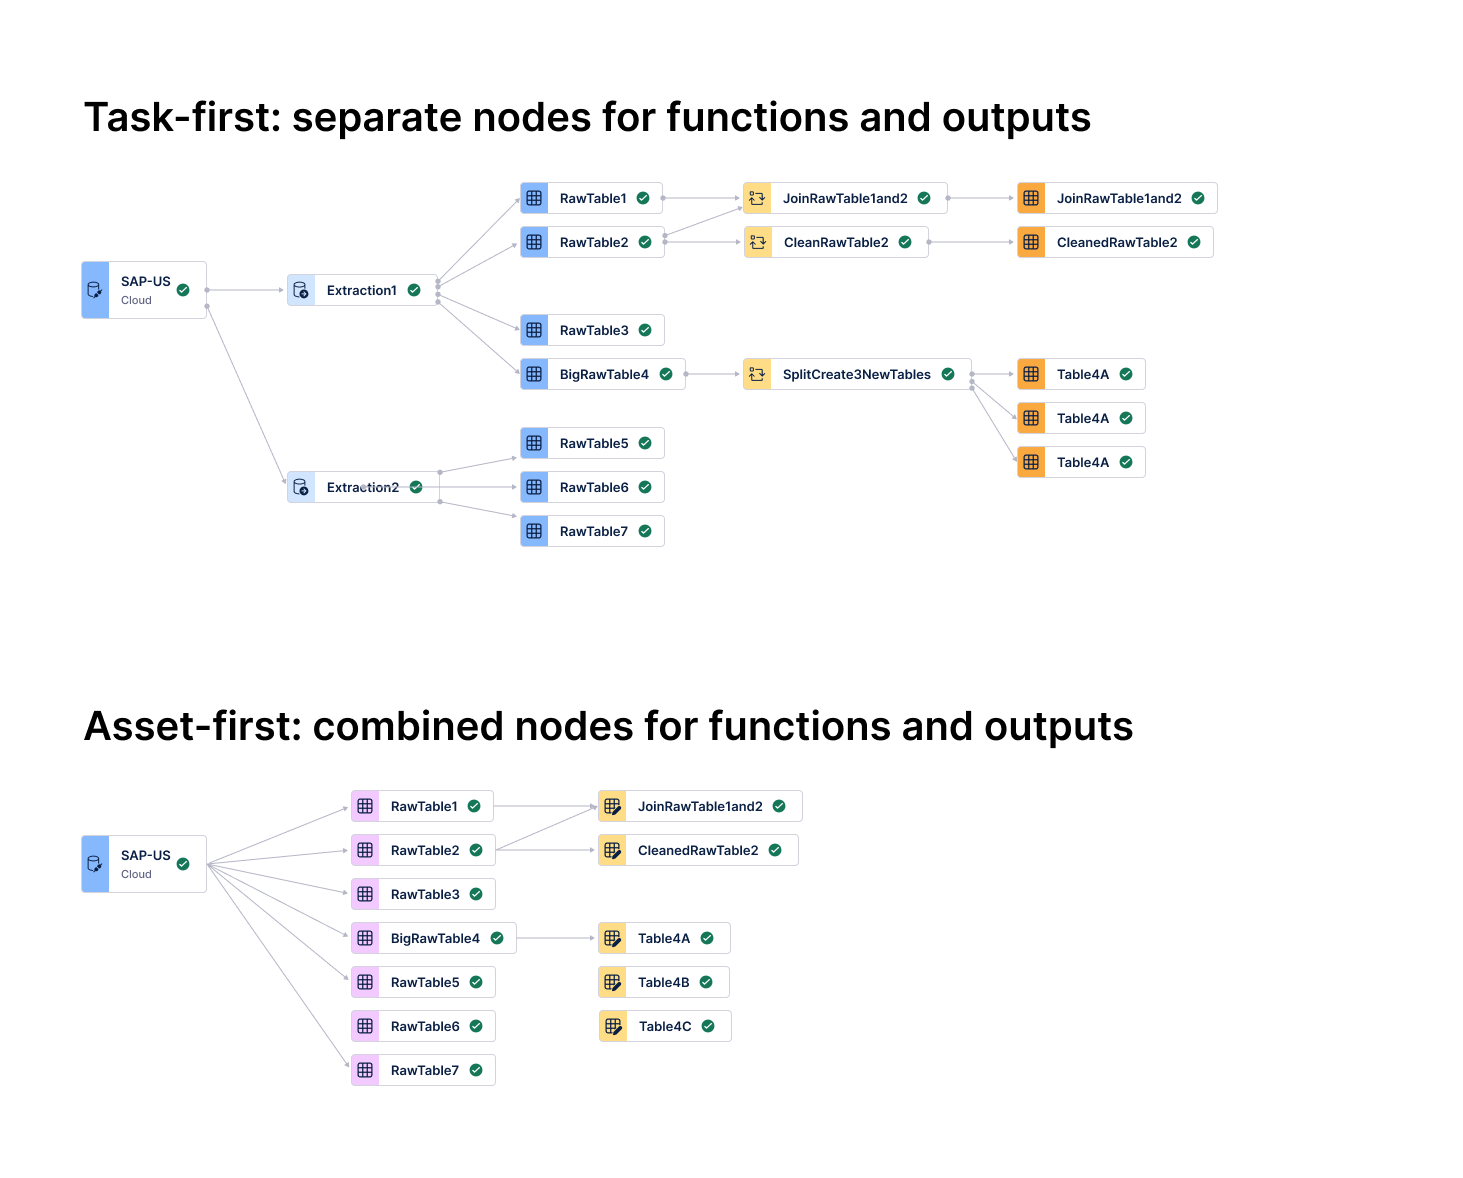
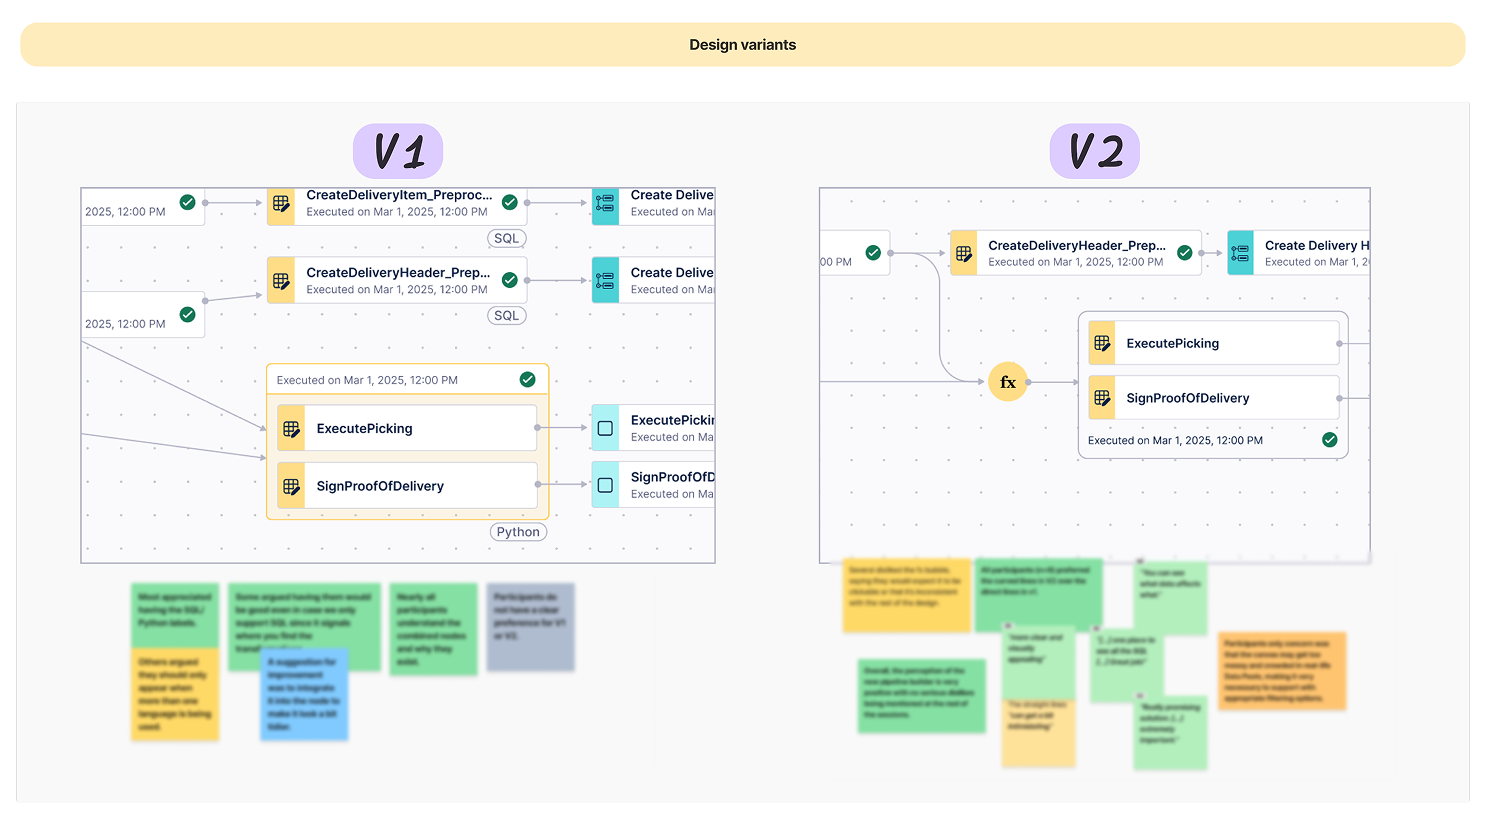
Task-first (top): separate nodes for functions and outputs — dense and hard to trace. Asset-first (bottom): consolidated nodes, 50%+ density reduction.
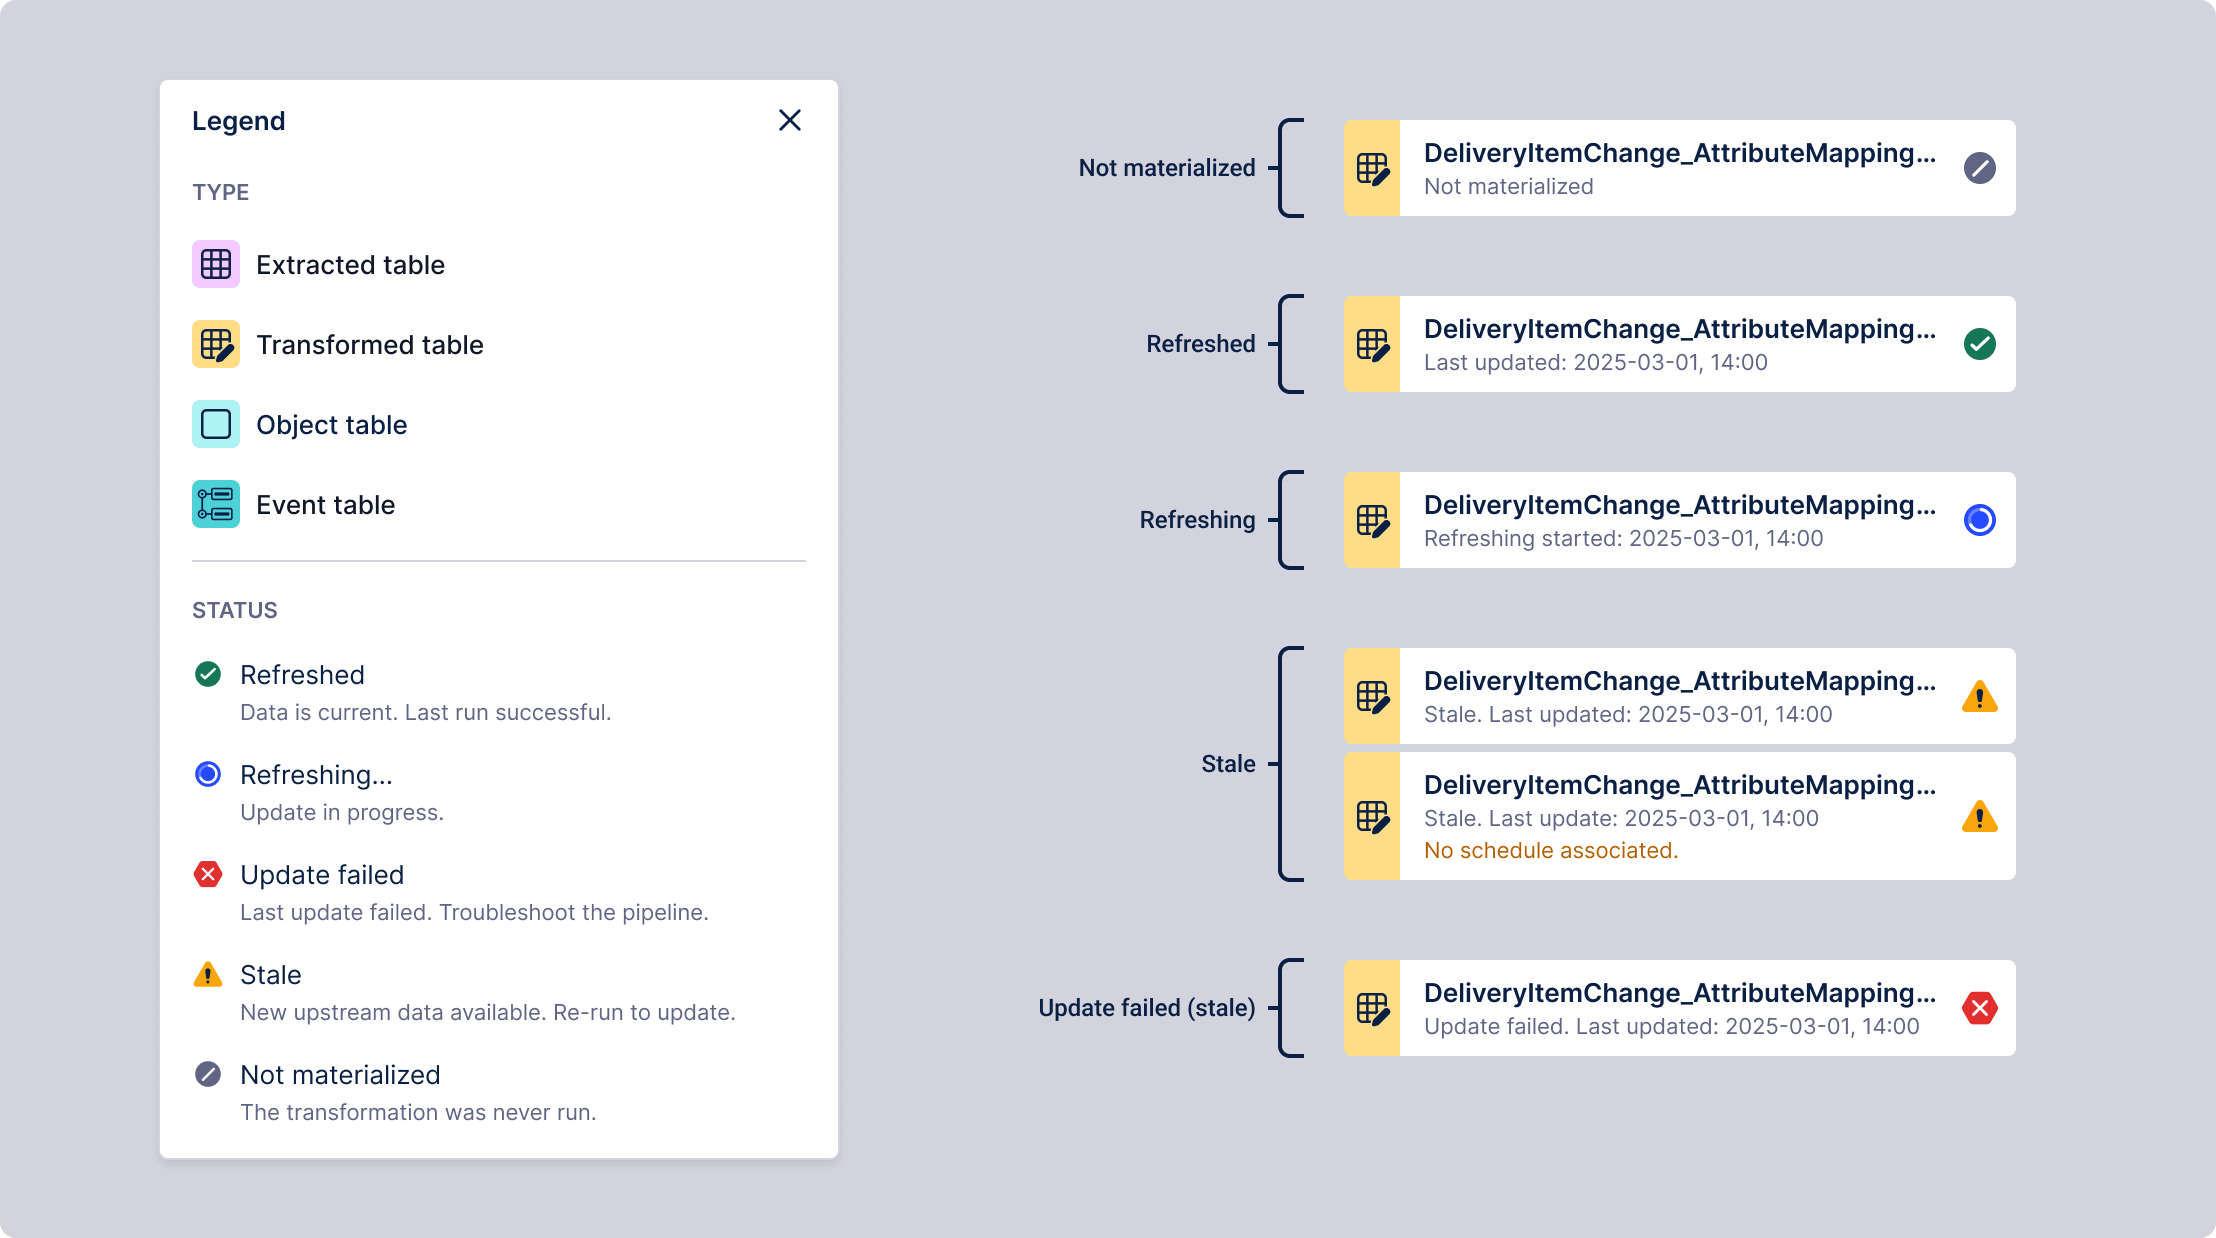
Asset health (Refreshed, Stale, Failed) surfaced at top level — SQL and Python code one click away
The shift: asset-first architecture
After quick testing, I pivoted the UI from a "Task-first" to an "Asset-first" mental model. By treating data tables — not individual jobs — as the primary nodes, I aligned the interface with modern industry standards like Software-Defined Assets.
- Scalability via consolidation: Consolidating tasks into single "Actionable Nodes" reduced canvas density by more than 50%, preventing the "spaghetti" effect common in enterprise-scale pipelines.
- Progressive disclosure: I prioritized asset health (Refreshed, Stale, Failed) at the top level, allowing engineers to monitor the entire lineage at a glance while keeping deep-dive SQL or Python code one click away.
- Outcome-driven design: This shift moved focus from "managing the plumbing" to "observing the data state," drastically reducing the time to identify and fix pipeline breaks.
Source ingestion, SQL transformation, and semantic modeling in a single, continuous canvas
Guided transformation and modeling flow
The design consolidated the fragmented stages of the data lifecycle — source ingestion, SQL transformation, and semantic modeling — into a single, unified canvas. A contextual menu surfaces relevant next-steps based on the selected table type, allowing data engineers to logically progress from extracted data to semantic types without ever leaving the visual canvas.
By bringing ETL and modeling into one view, we eliminated the friction of jumping between disconnected product areas. This integrated approach provides immediate visibility into data dependencies, transforming a historically disjointed process into a continuous, intuitive workflow.
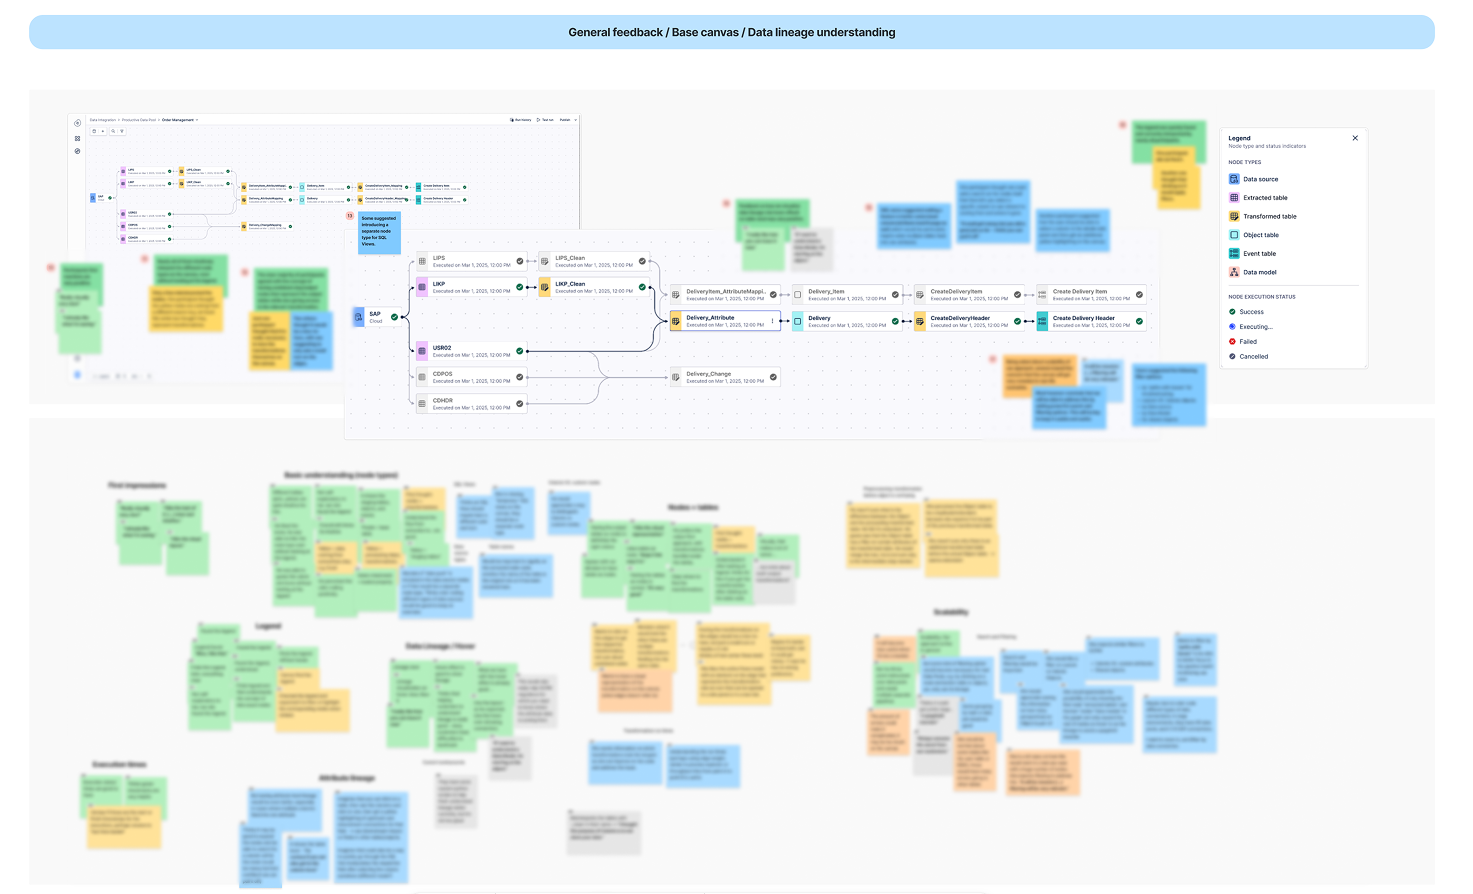
Validation sessions confirmed the asset-based model — testing also highlighted a need for advanced search and filtering at enterprise scale
User validation on the mental model
Testing with data engineers confirmed the asset-based mental model was highly intuitive. Participants instantly decoded complex data sources and SQL transformations without training.
"I really like how you can trace it now... one place to see all the SQL. Great job!"
- Intuitive traceability: Users cited the unified view of data flow as a major productivity booster for troubleshooting.
- Actionable nodes: The "combined node" approach successfully balanced high-level data assets with the ability to "drill down" into underlying SQL code.
Orthogonal: clean in static mocks, high cognitive noise at scale
Design decision
The graph style: prioritizing interpretability at scale
In node-based systems, "clean" aesthetics often collapse under real-world data volume. While Orthogonal (Angled) lines appear more orderly in static mocks, they introduce significant cognitive noise through overlapping paths and corner fatigue in complex pipelines.
After testing with vibe coding and consulting data visualization experts, I advocated for Curved edges with specific collision avoidance rules. The organic bundling allows an engineer to instantly perceive a node's centrality and trace dependencies across the canvas — a natural "information scent."
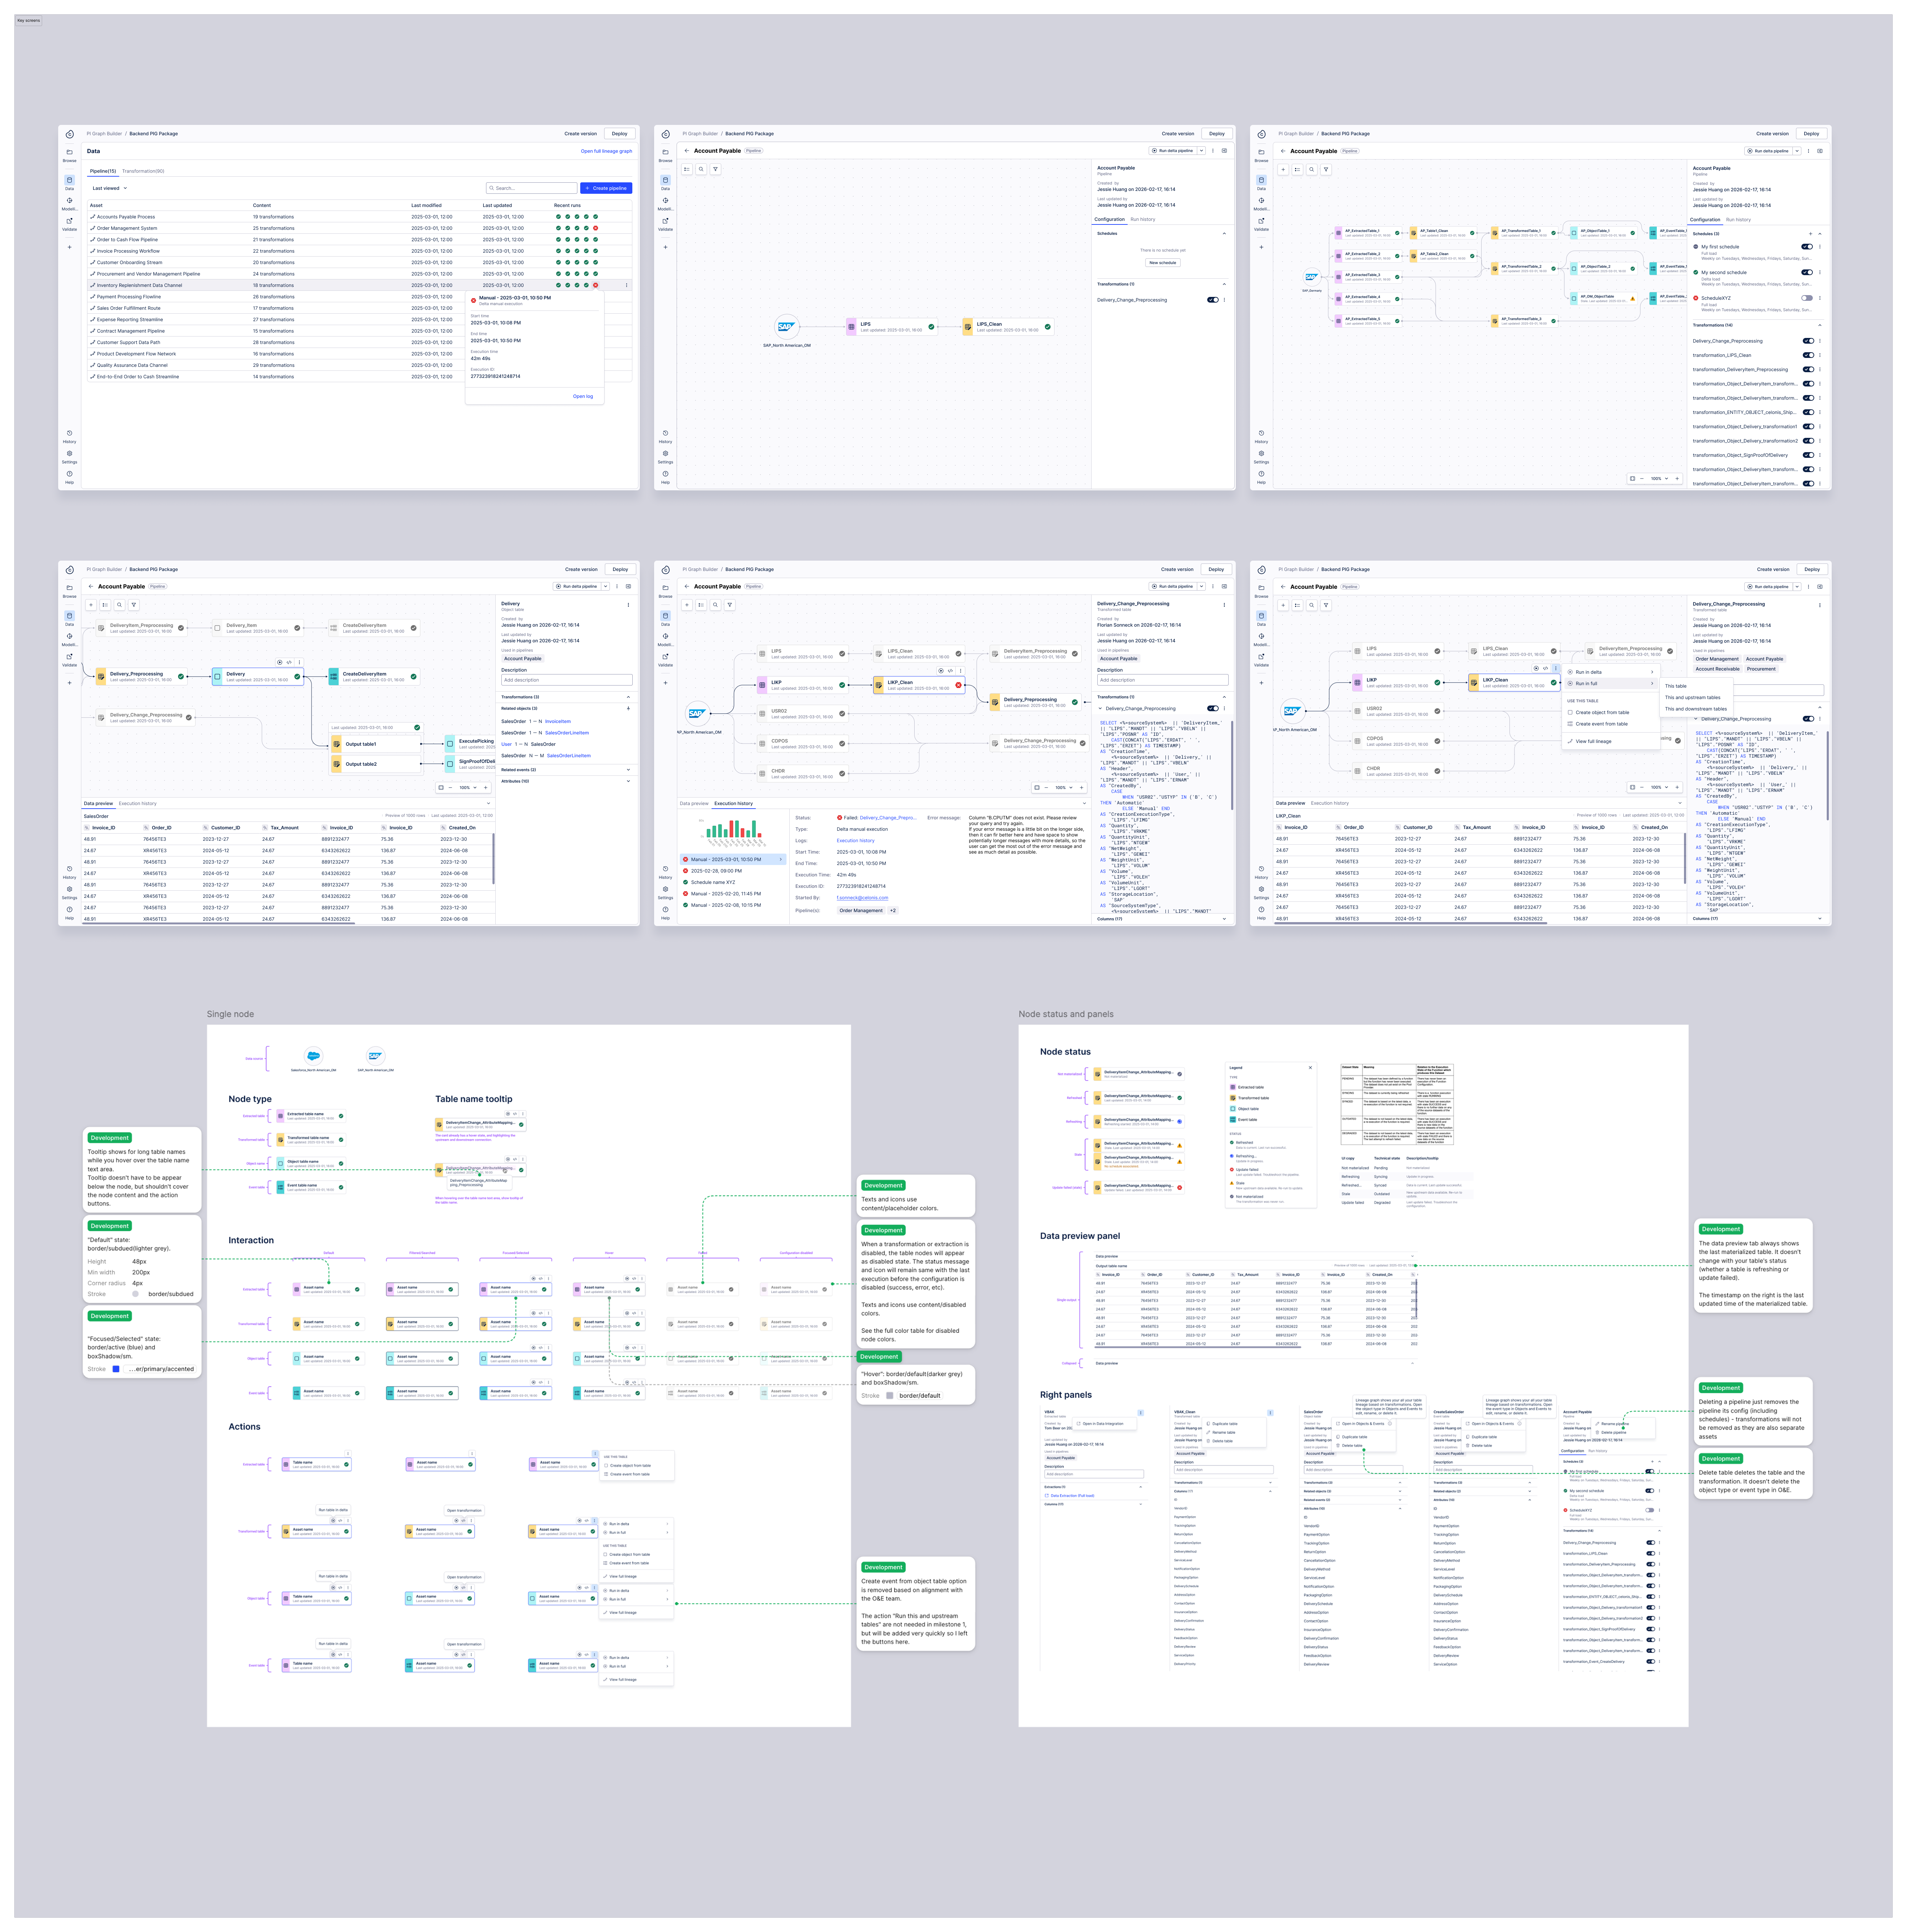
Final design — key screens across the pipeline builder experience
Side panel exposes all pipelines a table is used in — one click to full lineage view across all pipelines
View a table's full lineage across pipelines
A pipeline is just a grouping mechanism for transformations. Because a single transformation can exist across multiple pipelines with different refresh schedules, troubleshooting "stale" data previously required engineers to manually parse hundreds of lines of SQL to find the break.
I designed a full table lineage view that surfaces cross-pipeline dependencies directly in the workspace. When a user selects any table, the side panel exposes all the pipelines it is used in — and one click switches from a single pipeline view to the full lineage view across all pipelines.
Impact
From prototype to Tier-1 contract expansion
This initiative is transitioning Celonis from legacy code-editing to a modern, declarative ecosystem. I independently developed a high-fidelity vibe coding prototype that was leveraged in executive demos within one month — directly contributing to contract expansions by validating our roadmap for Tier-1 accounts.
- Competitive strategy: Addressed critical friction points in loading data to Snowflake and Databricks, proving our viability as a primary analysis hub over key competitors.
- Workflow transformation: Shifted the user experience from a manual "modeling-first" bottleneck to a visual "data-first" governance model, fundamentally accelerating the path to first analysis.